Field guide
How to read the field
Start with the market
- Open the interactive field and explore the market. Add a species when you want to compare a strategy or rival. Check whether its record is simulated, a fund return, or a reconstruction from filings.
- Select a colony to inspect a security. Each colony is one security; an individual square cell is not a company. The organisms show which holdings the chosen record grazes on.
- Move through the dates to inspect a past state. The latest filing date can differ from the value date.
- Open Results from the selected record to compare value and drawdown. Drawdown is the fall from that record's earlier peak.
Set the detail you need
Labels shows security codes. Chart adds the selected records' value history. Species chooses which records appear; clearing them leaves the market itself.
Sketch keeps the readout short. Measurements reveals the values and their qualifications. These settings change the labels and readout, never the underlying data. Notes and additional Senses are marked later until their sources are available.
The interval menu states the supported clock. This website uses daily sessions. Copy view preserves the date, selection and display settings; a copied view opens paused.
What the map means
Regions of the map hold securities that tended to move together over 120 sessions. Regions far apart tended to move differently. The map is flat, so it keeps only part of the true distances. Colonies side by side are usually not each other's closest partner. Positions come from classical multidimensional scaling of correlation distance, so they approximate relationships. They are not geography, and they do not show cause. The layout updates every 5 sessions; prices update every session. The scale bar reads 0.25 correlation distance.
Every channel of Fig. 1
- A colony of cells
- one security
- Colony size
- share of the biome by value
- Hue
- distance below the 52-week high
- Lightness
- 21-session return
- Colonies pulsing together
- one factor explains more
- Up the field
- higher market beta
- Rim mark
- A colony outside the field of view. Its size follows its market value. Its place on the rim is its direction.
- Ring
- A ring in green marks a holding of the selected record.
- Each organism
- $250 of capital
- Organisms in the bowl
- reserve cash
Each series and its source
Prices and market values are from Financial Modeling Prep. Index membership is from the same vendor: its list of today's S&P 500 members, and its record of past changes, which rebuilds each past session. Past market values are from the same vendor too, and the table under Market cap corrections restates them.
Total return uses dividend-adjusted closes. The dividend yield's denominator is the unadjusted close. Each is the right series for its job.
Holdings come from three sources. The benchmark's holdings are computed from index membership at each session's market value. The four funds' holdings come from their N-PORT filings with the SEC, which lag; the two managers' holdings come from their quarterly 13F filings, which show long positions only and can arrive up to 45 days after the quarter ends.
Where the membership comes from
The biome is the US large cap 100: the hundred largest companies in the S&P 500 by market value, rebuilt for each session from constituent data.
S&P 500 is a trademark of S&P Dow Jones Indices LLC. Trophik is not affiliated with, endorsed by or sponsored by S&P Dow Jones Indices LLC.
Market cap corrections
The vendor understates a company’s past market capitalization after a spin-off. Trophik restores it from the filings, so a colony is drawn at the size the company actually was. The vendor scales the past cap down the way an adjusted price is scaled, and Trophik multiplies it back by the factor in the table. The factor is known only after the separation. So the correction uses a fact the market did not have on those dates, a mild look-ahead. Every restatement we found is listed here. The largest factor is AIV’s, 7.501.
Some rows are not spin-offs. They correct a share count that the vendor applied on the wrong date, and their factor can be less than 1.
Historical membership depends on this table. As of the build of October 9, 2026, from January 2, 2020 to October 8, 2026, the table changes which companies make the drawn top 100 on 1,629 of 1,701 sessions. Counted by company and session, it changes membership 5,476 times and changes a rank 72,419 times.
The table holds 41 rows over 33 companies: 30 separations and 11 share count timing corrections. Every row cites its SEC filing. The corrected values restore the share count of each filing to within about 500 shares.
As of the build of October 9, 2026, from January 2, 2020 to October 8, 2026, the vendor applied the new TMUS share count one quarter early, on 62 sessions. Corrected, TMUS ranks 66th to 98th on those sessions, where the vendor put it 46th to 64th. It stays in the top 100 either way. Its colony size and its weight in a cap-weighted species change.
The DASH and UBER corrections cannot change the drawn set, because neither company was in the index on the affected dates. The FIS, FISV, NEM, TFC and UBER rows have no effect on a shown session. They fall before the first shown session, and the engine reads market capitalization only on the current session, never over a window. The rows stay, so the data states what the filings state.
| Company | Event | Restated | Effect on past size |
|---|---|---|---|
| AIV | Apartment Income REIT separation | before 2020-12-15 | Past cap multiplied by 7.501 |
| BDX | Embecta | before 2022-04-01 | Past cap multiplied by 1.025 |
| BDX | Waters combination of the biosciences unit | before 2026-02-10 | Past cap multiplied by 1.272 |
| BWA | PHINIA | before 2023-07-05 | Past cap multiplied by 1.136 |
| DHR | Veralto | before 2023-10-02 | Past cap multiplied by 1.128 |
| DTE | DT Midstream | before 2021-07-01 | Past cap multiplied by 1.175 |
| EXC | Constellation Energy | before 2022-02-02 | Past cap multiplied by 1.402 |
| FBIN | MasterBrand | before 2022-12-15 | Past cap multiplied by 1.170 |
| FDX | FedEx Freight | before 2026-06-01 | Past cap multiplied by 1.241 |
| FTV | Vontier | before 2020-10-09 | Past cap multiplied by 1.043 |
| FTV | Ralliant | before 2025-06-30 | Past cap multiplied by 1.327 |
| GE | GE HealthCare | before 2023-01-04 | Past cap multiplied by 1.281 |
| GE | GE Vernova | before 2024-04-02 | Past cap multiplied by 1.253 |
| HON | Solstice | before 2025-10-30 | Past cap multiplied by 1.062 |
| HON | Honeywell Aerospace | before 2026-06-28 | Past cap multiplied by 1.907 |
| IBM | Kyndryl | before 2021-11-04 | Past cap multiplied by 1.046 |
| ILMN | Vendor price rewrite | before 2024-06-25 | Past cap multiplied by 1.029 |
| IP | Sylvamo | before 2021-10-01 | Past cap multiplied by 1.056 |
| J | Amentum | before 2024-09-30 | Past cap multiplied by 1.197 |
| K | WK Kellogg | before 2023-10-02 | Past cap multiplied by 1.024 |
| LH | Fortrea | before 2023-07-03 | Past cap multiplied by 1.164 |
| MMM | Solventum | before 2024-04-01 | Past cap multiplied by 1.196 |
| MRK | Organon | before 2021-06-03 | Past cap multiplied by 1.048 |
| PFE | Viatris | before 2020-11-17 | Past cap multiplied by 1.054 |
| RTX | Carrier and Otis | before 2020-03-31 | Past cap multiplied by 1.589 |
| T | WarnerMedia | before 2022-04-11 | Past cap multiplied by 1.324 |
| TT | Ingersoll Rand industrial unit | before 2020-03-02 | Past cap multiplied by 1.289 |
| WDC | Sandisk | before 2025-02-24 | Past cap multiplied by 1.323 |
| ZBH | ZimVie | before 2022-03-01 | Past cap multiplied by 1.030 |
| CMCSA | Versant | from 2025-12-08, before 2026-01-05 | Past cap multiplied by 1.067 |
| TMUS | Share count date corrected | from 2019-12-31, before 2020-04-01 | Past cap multiplied by 0.693998 |
| FIS | Share count date corrected | from 2019-07-01, before 2019-07-31 | Past cap multiplied by 0.627907 |
| FIS | Share count date corrected | from 2019-07-31, before 2019-09-30 | Past cap multiplied by 1.188846 |
| FISV | Share count date corrected | from 2019-07-01, before 2019-07-29 | Past cap multiplied by 0.671170 |
| FISV | Share count date corrected | from 2019-07-29, before 2019-10-01 | Past cap multiplied by 1.162611 |
| NEM | Share count date corrected | from 2019-04-01, before 2019-04-18 | Past cap multiplied by 0.697128 |
| NEM | Share count date corrected | from 2019-04-18, before 2019-07-01 | Past cap multiplied by 1.070018 |
| TFC | Share count date corrected | from 2019-09-30, before 2019-12-06 | Past cap multiplied by 0.830375 |
| TFC | Share count date corrected | from 2019-12-06, before 2019-12-31 | Past cap multiplied by 1.454386 |
| DASH | Share count date corrected | from 2020-12-09, before 2020-12-31 | Past cap multiplied by 2.717033 |
| UBER | Share count date corrected | from 2019-05-10, before 2019-07-01 | Past cap multiplied by 1.528459 |
When a name has too little history
A species picks a name by a measure only after the name has that measure's full window of price history. Until then, the name is not chosen by that measure. This rule decides which names a species may pick. It does not change how the field draws a colony. The name stays in the field, and a species can still hold it.
Four measures need close to a year of price history to rank a name: the 252-session return and the 252-session beta, which each need 253 closes, and the percentage fall below their 252-session high and the dividend yield, which each need 252 closes. As of the build of October 9, 2026, from January 2, 2020 to October 8, 2026, these four measures together exclude 20 name-days on the real data, all for one name, GEV.
When a security stops trading
Trophik fills a gap inside a series, but it never extends a series past its last real bar. The vendor can keep publishing a price after a stock stops trading. When a removal or delisting record confirms the end, the series is cut at the last real close. Without such a record, the build reports the repeated closes and does not cut them.
The build of October 9, 2026 cut 1 series in its window, January 2, 2020 to October 8, 2026: ATVI. The cut closes, from October 13, 2023 to October 20, 2023, are a price the vendor kept publishing after the stock stopped trading. A removal record dated October 17, 2023 confirmed the end. No series was cut without such a record.
A species that holds the security sells it at that last real close. Trophik does not model cash paid in a merger. The rule is the same for every security.
ATVI is an example. ATVI last traded on October 12, 2023, and its holders received $95.00 in cash. The ledger sells at $94.42, the last real close, on October 13, 2023. The difference is about 0.6 percent.
How form follows the rules
A species' body plan shows how often it reviews its holdings. Its appendages show how many holdings its genome allows. Neither says whether it is any good.
Ciliate oval
Reviews every session or faster.
Segmented zooplankton
Reviews weekly.
Rotifer crown
Reviews monthly.
Shelled amoeboid
Reviews when a trigger fires.
Observed form
Rules not disclosed.
| What you see | Sets | Never encodes |
|---|---|---|
| Body plan | Review schedule: how often the species reviews its holdings | Skill, risk or past returns |
| Lobes, cilia rows, segments or pseudopods | Holdings allowed: how many positions the genome permits | How much capital it has |
| Notch marks | Species identity, when two species share a body plan | Rank or version |
| Number of organisms | Capital, at $250 per organism; the same scale for every species | Tests survived |
| Movement speed | Turnover, the trading rate, measured for a species and implied from filings for a rival | A trade on every frame |
Master drawings of the body plans
One drawing for each plan, made once and reused everywhere: on this page and on each field sheet at full size, and reduced to a silhouette in the field. Light falls from the upper left. Contours are light on the lit side and heavy in shadow.
a Rotifer crown
Reviews monthly.
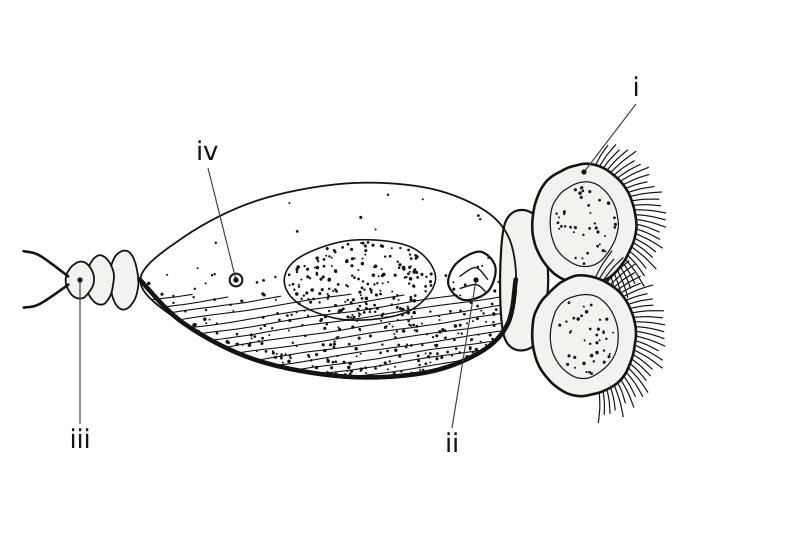
field size
- Corona of two ciliated lobes. The number of lobes follows how many holdings the genome allows.
- Mastax, the jaw.
- Telescoping foot.
- Identity notch.
b Ciliate oval
Reviews every session or faster.
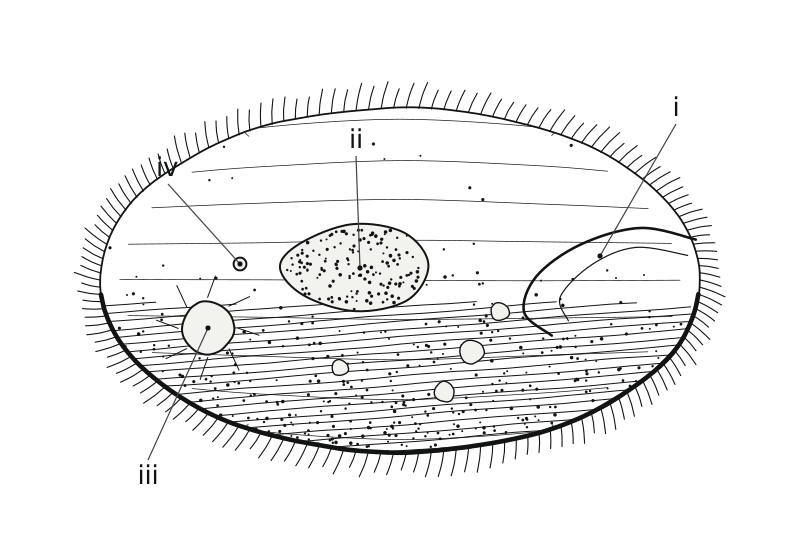
field size
- Oral groove.
- Macronucleus.
- Contractile vacuole.
- Identity notch. Cilia rows thicken with the holdings allowed.
c Segmented zooplankton
Reviews weekly.
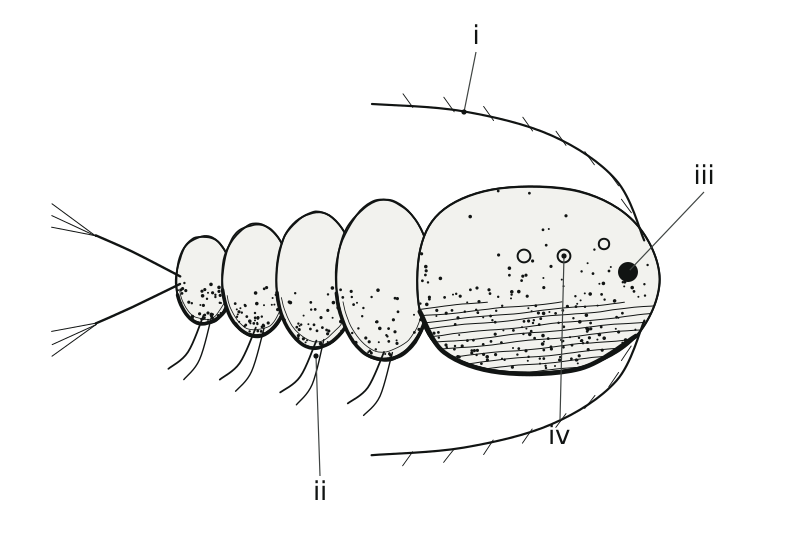
field size
- Antennule, drawn swept back.
- Swimming legs, one pair to each segment. Segments follow the holdings allowed.
- Eye.
- Identity notches.
d Shelled amoeboid
Reviews when a trigger fires.
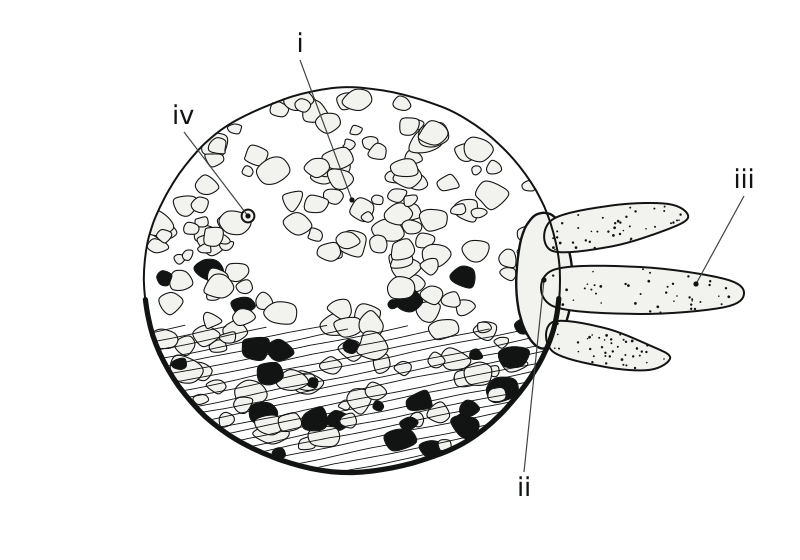
field size
- Shell built from gathered particles.
- Aperture.
- Pseudopods, one per step of holdings allowed; withdrawn in stasis.
- Identity notch.
e Observed form
Rules not disclosed.
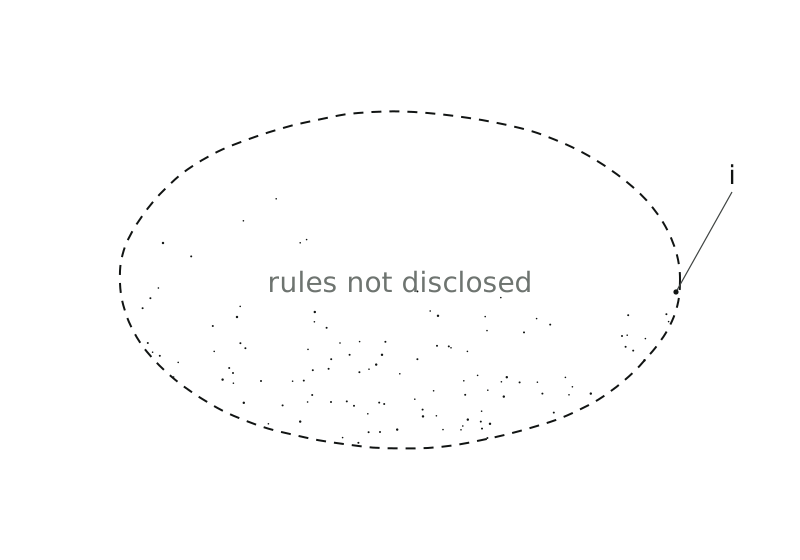
field size
- Outline only. No genome is known, so no anatomy is invented.
States
In stasis: contracted inside a cyst wall.
Extinct: drawn as an empty outline.
Drawing rules
Light falls from the upper left. Contour is light on the lit side and heavy in shadow; hatching sits at a four-point pitch, and stipple thickens toward the shadow.
Form carries meaning and nothing else. Size never changes. No plan is drawn more handsomely than another, because a body plan says how often a species reviews, not how good it is.
Paper simulation only.